VMTU-10 Software
Data processing Software package
QMT – is a Quality of MT data estimation software
The input data for the QMT program are text files obtained by the logger of VMTU-10 station. The conclusion about the suitability of the data for the following processing using magnetotelluric sounding method is formed on the basis of checking the coherence criteria. It is analyzing the multiple coherence, the coherence between inputs and percentage of the data matches the criteria. The program works in console mode. The result of program is two kind of text reports. The first one is used for detection of the field polarization angles and calculations spectra and coherencies in these directions. The second one is used for checking the matching the coherence criteria for the main processing using magnetotelluric sounding method.
QMTview – is plots QMT data.
The input data for the QMTview program are text reports obtained by QMT program. The interface of this program after the import of the reports is shown in the Figure 1. In the position 1 shown the coherence criteria used for analysis. The result matching the data for this criteria are shown in the position 2 (“Yes” on the green field is OK and “NO” on the red field in the other case).
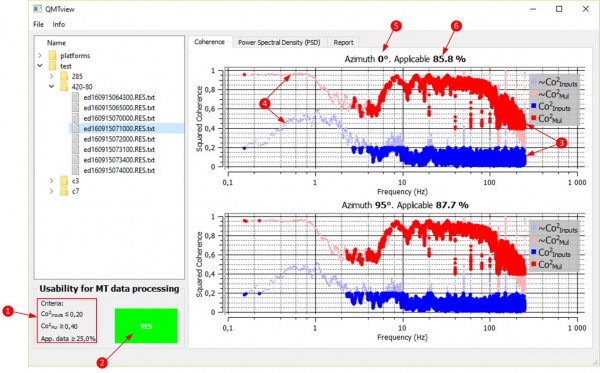
The blocks of the coherence graphs show the data that meets the specified criteria with unshaded colors and those that do not meet the shaded ones (Position 3 in Fig. 1). The upper part of these blocks displays information about the polarization angles and the amount of usable data (Position 5 and 6 in Fig. 1).
The program QMTview does not generate output files.
VMTU-1D – data processing software with 1D inversion.
The input data for the QMT program are text files obtained by the logger of VMTU-10 station. When the QMT program reports exists, they are also used as input files in order to inform the user about the data quality, about certain angles of incidence and strike of the structure, as well as the interval of periods in which it is possible to obtain magnetotelluric results.
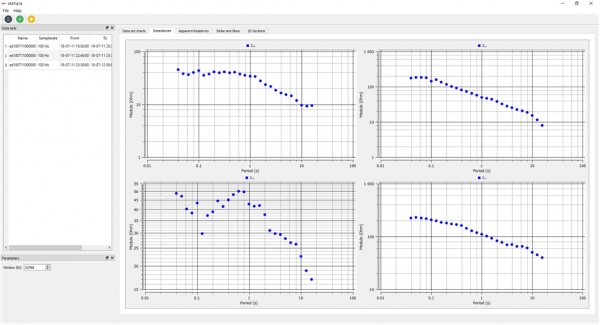
The operator can analyze in the graph charts the field data, all components of the impedance matrix , the apparent resistivity and impedance phase, the Swift asymmetry parameter Skew and the Strike direction as well as one-dimensional models in the direction of the structure’s fall and strike. The inverse problem is solved by the method of controlled transformation of unsmoothed magnetotelluric data with the estimating of RMS.The results can be saved in 2 formats – a text column file (ASCII) and an EDI file.